By John M Quick

The R Tutorial Series provides a collection of user-friendly tutorials to people who want to learn how to use R for statistical analysis.


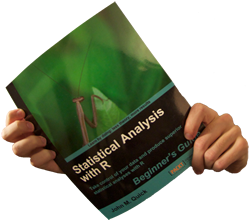
My Statistical Analysis with R book is available from Packt Publishing and Amazon.


The R Programming Wikibook

The R Programming wikibook is an open source community project that "aims to create a cross-disciplinary practical guide to the R programming language." It was launched in June 2011 and is seeking content and contributors. The full call for the R Programming wikibook can be found on Tal Galili's blog. The R Programming wikibook itself is available at http://en.wikibooks.org/wiki/R_Programming.

I am writing to raise awareness for the R Programming wikibook and to formally offer content from the R Tutorial Series by John M. Quick for use under a Creative Commons Attribution-ShareAlike 3.0 Unported License. This means that articles from the R Tutorial Series may be included in and modified for the R Programming wikibook, so long as proper attribution is given and the resulting content is made available under an equivalent license. A complete list of contributing blogs can be found on the R Programming wikibook's Sources page. I hope that the R Programming wikibook will thrive and grow to support a large community of R users, including readers of the R Tutorial Series.

Book Review: R Graphs Cookbook

Book Information

Mittal, H. (2011). R graphs cookbook. Birmingham, UK: Packt Publishing Ltd.

Audience

The book's stated audience is anyone who is familiar with the basics of R, as well as expert users who are looking for a graphical reference. However, it is my opinion that the book is better suited for advanced users who are already somewhat familiar with R graphics and are very comfortable with programming in R.

Content

To begin, the first chapter of R Graphs Cookbook rapidly introduces all of the major graphic types covered in the book. Next, in Chapter two, readers are acquainted with various arguments and modification functions that are used throughout the book to customize and enhance visuals. Subsequently, individual chapters focus on specific topics in R graphics, such as:

  1. scatterplots,
  2. line and time series charts,
  3. bar, dot, and pie charts,
  4. histograms,
  5. box plots,
  6. heat and contour maps,
  7. geographical maps, and
  8. exporting and annotating graphics.

Analysis

I will start with some general impressions, before moving into chapter by chapter analyses.

First, I feel that the book needs both more and larger screenshots. Often times, recipes are without any visuals and most of the time only one is present, whereas one per major graphical modification is expected. Furthermore, the screenshots are too small. These are critical items to neglect in a book that explicitly deals with visuals. Fortunately, full-size, full-color images are provided with the downloadable code for the book.

Second, I feel that the topics presented in the book are glanced over with far too little explanation. This is the main reason that I feel it is not suited for those who are not already well versed in R programming. Moreover, R Graphs Cookbook frequently refers the reader to help documentation or to other books on R, which can be frustrating. I personally feel that a book should be largely self-contained, at least when discussing topics within its scope.

Third, I believe that the book could be better organized for use as a fast reference guide and that it generally could be better structured to present information. For example, rather than tables are a clearer way to present head to head comparisons between objects, and lists are better for describing several function arguments.

On the other hand, I do like the book's code formatting, which displays one argument per line. While this could confuse novice users into thinking that each argument is a separate line of executable code, most readers should find this a welcomed organization style for often lengthy graphics functions. I also enjoyed how the see also sections at the end of each recipe let me know whether more recipes would build on a given topic.

Continuing, chapter one felt like a whirlwind of information that charged forward with a lack of purpose, organization, and explanation. Chapter two was much better, offering several nice recipes that were fast and easy to digest, with just enough information provided.

Chapter three takes an in-depth look at scatterplots and provides a number of useful recipes, such as how to group data, label points, generate error bars, and create graphical correlation matrices. Similarly, chapter four provides a solid collection of recipes for time series and line charts.

In contrast, chapters five through seven cover a disappointingly sparse amount of material related to their respective topics. Unfortunately, they do not stretch far beyond what is covered in the two graphics-focused chapters of Statistical Analysis with R, which is a guide for newcomers and early beginners. From an advanced reference like R Graphs Cookbook, I expected broader coverage. For instance, very few external packages are presented in this book, with the author choosing to focus on built-in graphics functions almost exclusively. An introduction to external options, such as ggplot2, would be warmly welcomed.

Chapters eight and nine relate a few of the lesser covered topics in R, including heat, contour, and geographical maps. These chapters will likely be informative and valuable for readers interested in these graphical applications.

Lastly, chapter ten deals with the presentation and exportation of graphics. While I wish a deeper exploration was made, there are some useful tips in is chapter. Namely, the use of the expression() function to annotate graphics is well covered.

Brief Summary

  • Title: R Graphs Cookbook
  • Author: Hrishi Mittal
  • Where To Find: Packt Publishing
  • Audience: those who are comfortable programming in R, able to mix, match, apply, and extend recipes for their own purposes, and looking to learn more about R's built-in graphical capabilities.
  • Content: a loosely associated collection of recipes for applying R's built-in graphics functions to create the most common types of charts, graphs, plots, and maps.
  • Analysis: although it could have better visuals, structure, and coverage, it is likely that almost any reader will be able to take away valuable techniques from this book
  • Arbitrary Rating: 6/10
  • Recommendation: take a look at the table of contents and count the number of recipes that would both be useful to you and that you do not already know how to accomplish to get an idea of how much you will take away from this book; also read the free sample chapter
  • Disclaimer: I received a review copy of this book

Statistical Analysis with R Book Reviews

Reviews of my Statistical Analysis with R book have started to emerge online and I am writing today to share them with potential readers and recommenders.

Reviews

The following is a list of online reviews for Statistical Analysis with R. If you have written a review of the book and would like it to be featured in this post, please contact me.
In summarizing the reviews, a few points are very clear about Statistical Analysis with R.
  1. It is for beginners: The book was written for people who have little to no experience with R, statistical software, and programming. It makes no assumptions of prior experience along these lines and starts right from the beginning. If you are new to R and want to learn how to apply it to your work, then this book is for you. If you are already an intermediate or experienced user, perhaps you might recommend it to people you know who are just becoming familiar with R.
  2. It is a learning tool, not a reference: The book is structured with the intent that it is experienced as a holistic learning experience. The chapters build on one another and progressively delve deeper into R. It is not a dictionary-style reference that one might pull out, flip to an entry, and get a brief answer on a single item. Again, this has implications for the audience. Beginners are more likely to enjoy this approach, whereas experienced users may be interested in more of a reference-style book.
  3. It has a story: Woven into the book's learning structure is a storyline based on the Three Kingdoms period of ancient Chinese history. For many, this will be a motivating and engaging way to learn. For others, the story may not inspire the same level of interest. If you would like to get a taste of the story, and the book in general, it is recommended that you read the free sample chapter.

New Release: R Graph Cookbook

Packt Publishing recently released a second book on R, the R Graph Cookbook by Hrishi Mittal. This reference-style guide covers an array of R graphical applications and is geared towards users who are already familiar with the basics of R. A sample chapter is available. I will be reviewing this book in the near future and posting my thoughts here on the R Tutorial Series blog. [Update: read my review of R Graph Cookbook]

R Beginner's Guide Book Update: Statistical Analysis with R Released

In the final days of October, my beginner's guide to R was released. The book's official title is Statistical Analysis with R and it can be found on the Packt Publishing website.
The primary focus of Statistical Analysis with R is helping new users become accustomed to R and empowering them to apply R to suit their own needs. No prior experience with R, statistical software packages, or programming is necessary to learn from this book. It is written for a broad audience and should be well received by businesspeople, IT professionals, researchers, and students alike. Statistical Analysis with R takes readers on a journey from their first installation and launch of R, to analyzing and assessing data, to communicating and visualizing results. This guide is an excellent way to rapidly become an experienced R user and learn the skills that you need to apply R to your work.

Samples

A sample chapter from Statistical Analysis with R is available from the Packt website. This chapter, the book's eight, introduces the graphical capabilities of R, such as generating, customizing, and exporting various plots, charts, and graphs. You can download the sample chapter and its accompanying R files for free. If you like this chapter and are interested in learning more about R's graphical capabilities, you should know that chapter 9 demonstrates in depth how you can build and customize your own R visualizations.
The publisher has also posted a few brief samples from the book, which can be accessed via the following links. These samples are taken from chapters 7 and 8 of Statistical Analysis with R. Respectively, they cover the common process behind all R analyses and introduce the graphical capabilities of R.

Feedback

If you decide to read Statistical Analysis with R, please feel free to provide me with your feedback. It would be great to know what you learned from the book, how future guides could be improved, and your overall experience with R.

R Beginner's Guide Book Update 10/1/2010

Update: Statistical Analysis with R is now available!


I recently submitted the final drafts of all chapters of my R Beginner's Guide book, which is to be published through Packt. The official publishing timeline is set to December 2010, although the book may release ahead of schedule if all continues to go well. Below is an updated list of the major topics covered in the R Beginner's Guide.

Over the course of this book, you will acquire the knowledge and skills necessary to:

  • Conduct organized data analyses in R
  • Communicate data analyses conducted in R
  • Generate, customize, and export detailed charts, plots, and graphs
  • Build your own custom data visualizations
  • Program in the R language
  • Create your own custom functions
  • Extend the functionality of R via external packages
  • Manage the R workspace and console
  • Import external data into R
  • Manipulate data using variables
  • Execute a wide array of multi-argument and variable-argument functions
  • Develop and employ predictive regression models
  • Assess the practical and statistical significance of predictions
  • Understand R, its benefits, and how to use it to maximize the impact of your data analyses

R Beginner's Guide Book Update 7/19/2010

Update: Statistical Analysis with R is now available!


I am excited to announce that I have submitted the entire first draft of my R Beginner's Guide book, which is to be published through Packt. The tenth and final chapter was submitted a full month ahead of schedule. The printed book could become available in as little as three to four months.

Below is a list of the major topics covered in the R Beginner's Guide.

  • Understanding what R is, its benefits, and why to use it
  • Downloading, installing, and running R
  • Dissecting the anatomy of R
  • Programming in R
  • Handling external data
  • Using variables
  • Managing the R workspace and console
  • Using multi-argument and variable-argument functions
  • Creating predictive data models
  • Assessing practical vs. statistical significance
  • Regression modeling
  • Creating custom functions
  • Assessing the viability of predictions
  • Organizing and communicating data analyses
  • Generating, customizing, and exporting graphics
  • Building custom visualizations
  • Extending R via packages
  • Taking advantage of electronic learning resources

R Beginner's Guide Book Update 4/28/2010

Update: Statistical Analysis with R is now available!


I am writing to update you on the progress of my R Beginner's Guide book, which is to be published through Packt. I have really gotten to work over the past couple months and have recently completed the first draft of the first half of the book. Right now, I am operating a few weeks ahead of our planned schedule, which calls for the first draft of all ten chapters by mid-August.

To give you an idea of its content, the book focuses on most of the topics covered in this blog as well as many more, such as data visualization, custom functions, and online resources. The topics are covered in great depth and numerous opportunities for practice and exploration are offered. The book's theme centers around the Three Kingdoms period of ancient China. The reader takes on the role of the lead strategist for the Shu kingdom at a pivotal point in history. Throughout the book, the reader uses R to help devise a course of action for the Shu forces.

I will continue to make steady progress on this book over the summer months. I am also excited to be able to share more R tutorials and knowledge in the near future through this project.

R Tutorial Series: R Beginner's Guide and R Bloggers Updates


1/1/2011 Update: Tal Galili wrote an article that revisits the first year of R-Bloggers and this post was listed as one of the top 14. Therefore, I decided to make a small update to each section. I start by describing the initial series of tutorials that I wrote. A few more have been added since and even more planned in the upcoming year. As always, an up to date listing of my articles can be found on the R Tutorial Series blog. New posts will also continue to be offered through the R Bloggers network.


Since October 2009, I have written 13 articles [many more now, of course] for the R Tutorial Series blog. The first two introduce new users to R. The remaining 11 cover a wide range of topics related to multiple regression and correlation. This collection of tutorials represents my most recent training in statistics. Thus, for the time being, I will not be contributing new articles as frequently as I have over the past few months. However, I will undoubtedly encounter future projects that require new statistical methods and partake in more statistics courses, both of which will provide additional tutorial material. Below is a categorized list of the articles currently offered in the R Tutorial Series.

Introduction to R

Descriptive Statistics

Data Visualization

Correlation

Regression

I also have two additional R-related items to update you on. The first is the R Bloggers website and the second is my R Beginner's Guide.


1/1/2011 Update: I originally reported that 50 blogs composed the R Bloggers network. Now that number has risen to over 140. I hope that R Bloggers continues to thrive and contribute to the R community.


R Tutorial Series on R Bloggers

R Bloggers (http://www.r-bloggers.com) is a website that aggregates over 50 different blogs that focus on R. It is an excellent resource for keeping up to date on the many uses of R and for learning about the wide range of work being conducted in R. I recommend using R Bloggers for these purposes. The R Tutorial Series was invited to participate in the R Bloggers collection and is now available to R Bloggers' readers.

R Beginner's Guide


11/1/2010 Update: Statistical Analysis with R is now available!


Lastly, I want to let you know that I am working on a beginner's guide for R. It is primarily focused towards introducing R to information technology, business, and data analyst professionals. The book will be offered through PACKT Publishing (http://www.packtpub.com) and should be available within the next year. If you have enjoyed the R Tutorial Series, then you may be interested in looking for the guide once it is completed. In the meantime, keep reading the R Tutorial Series and R Bloggers and I will keep you updated on the book's major milestones.