Book Information
Mittal, H. (2011). R graphs cookbook. Birmingham, UK: Packt Publishing Ltd.
Audience
The book's stated audience is anyone who is familiar with the basics of R, as well as expert users who are looking for a graphical reference. However, it is my opinion that the book is better suited for advanced users who are already somewhat familiar with R graphics and are very comfortable with programming in R.
Content
To begin, the first chapter of R Graphs Cookbook rapidly introduces all of the major graphic types covered in the book. Next, in Chapter two, readers are acquainted with various arguments and modification functions that are used throughout the book to customize and enhance visuals. Subsequently, individual chapters focus on specific topics in R graphics, such as:
- scatterplots,
- line and time series charts,
- bar, dot, and pie charts,
- histograms,
- box plots,
- heat and contour maps,
- geographical maps, and
- exporting and annotating graphics.
Analysis
I will start with some general impressions, before moving into chapter by chapter analyses.
First, I feel that the book needs both more and larger screenshots. Often times, recipes are without any visuals and most of the time only one is present, whereas one per major graphical modification is expected. Furthermore, the screenshots are too small. These are critical items to neglect in a book that explicitly deals with visuals. Fortunately, full-size, full-color images are provided with the downloadable code for the book.
Second, I feel that the topics presented in the book are glanced over with far too little explanation. This is the main reason that I feel it is not suited for those who are not already well versed in R programming. Moreover, R Graphs Cookbook frequently refers the reader to help documentation or to other books on R, which can be frustrating. I personally feel that a book should be largely self-contained, at least when discussing topics within its scope.
Third, I believe that the book could be better organized for use as a fast reference guide and that it generally could be better structured to present information. For example, rather than tables are a clearer way to present head to head comparisons between objects, and lists are better for describing several function arguments.
On the other hand, I do like the book's code formatting, which displays one argument per line. While this could confuse novice users into thinking that each argument is a separate line of executable code, most readers should find this a welcomed organization style for often lengthy graphics functions. I also enjoyed how the see also sections at the end of each recipe let me know whether more recipes would build on a given topic.
Continuing, chapter one felt like a whirlwind of information that charged forward with a lack of purpose, organization, and explanation. Chapter two was much better, offering several nice recipes that were fast and easy to digest, with just enough information provided.
Chapter three takes an in-depth look at scatterplots and provides a number of useful recipes, such as how to group data, label points, generate error bars, and create graphical correlation matrices. Similarly, chapter four provides a solid collection of recipes for time series and line charts.
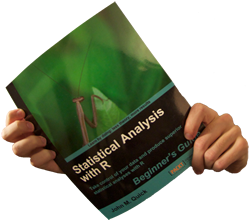
In contrast, chapters five through seven cover a disappointingly sparse amount of material related to their respective topics. Unfortunately, they do not stretch far beyond what is covered in the two graphics-focused chapters of Statistical Analysis with R, which is a guide for newcomers and early beginners. From an advanced reference like R Graphs Cookbook, I expected broader coverage. For instance, very few external packages are presented in this book, with the author choosing to focus on built-in graphics functions almost exclusively. An introduction to external options, such as ggplot2, would be warmly welcomed.
Chapters eight and nine relate a few of the lesser covered topics in R, including heat, contour, and geographical maps. These chapters will likely be informative and valuable for readers interested in these graphical applications.
Lastly, chapter ten deals with the presentation and exportation of graphics. While I wish a deeper exploration was made, there are some useful tips in is chapter. Namely, the use of the expression() function to annotate graphics is well covered.
Brief Summary
- Title: R Graphs Cookbook
- Author: Hrishi Mittal
- Where To Find: Packt Publishing
- Audience: those who are comfortable programming in R, able to mix, match, apply, and extend recipes for their own purposes, and looking to learn more about R's built-in graphical capabilities.
- Content: a loosely associated collection of recipes for applying R's built-in graphics functions to create the most common types of charts, graphs, plots, and maps.
- Analysis: although it could have better visuals, structure, and coverage, it is likely that almost any reader will be able to take away valuable techniques from this book
- Arbitrary Rating: 6/10
- Recommendation: take a look at the table of contents and count the number of recipes that would both be useful to you and that you do not already know how to accomplish to get an idea of how much you will take away from this book; also read the free sample chapter
- Disclaimer: I received a review copy of this book