By John M Quick

The R Tutorial Series provides a collection of user-friendly tutorials to people who want to learn how to use R for statistical analysis.


My Statistical Analysis with R book is available from Packt Publishing and Amazon.


R Tutorial Series: Two-Way ANOVA with Unequal Sample Sizes

When the sample sizes within the levels of our independent variables are not equal, we have to handle our ANOVA differently than in the typical two-way case. This tutorial will demonstrate how to conduct a two-way ANOVA in R when the sample sizes within each level of the independent variables are not the same.

Tutorial Files

Before we begin, you may want to download the sample data (.csv) used in this tutorial. Be sure to right-click and save the file to your R working directory. This dataset contains a hypothetical sample of 30 students who were exposed to one of two learning environments (offline or online) and one of two methods of instruction (classroom or tutor), then tested on a math assessment. Possible math scores range from 0 to 100 and indicate how well each student performed on the math assessment. Each student participated in either an offline or online learning environment and received either classroom instruction (i.e. one to many) or instruction from a personal tutor (i.e. one to one).

Beginning Steps

To begin, we need to read our dataset into R and store its contents in a variable.
  1. > #read the dataset into an R variable using the read.csv(file) function
  2. > dataTwoWayUnequalSample <- read.csv("dataset_ANOVA_TwoWayUnequalSample.csv")
  3. > #display the data
  4. > dataTwoWayUnequalSample

The first ten rows of our dataset

Unequal Sample Sizes

In our study, 16 students participated in the online environment, whereas only 14 participated in the offline environment. Further, 20 students received classroom instruction, whereas only 10 received personal tutor instruction. As such, we should take action to compensate for the unequal sample sizes in order to retain the validity of our analysis. Generally, this comes down to examining the correlation between the factors and the causes of the unequal sample sizes en route to choosing whether to use weighted or unweighted means - a decision which can drastically impact the results of an ANOVA. This tutorial will demonstrate how to conduct ANOVA using both weighted and unweighted means. Thus, the ultimate decision as to the use of weighted or unweighted means is left up to each individual and his or her specific circumstances.

Weighted Means

First, let's suppose that we decided to go with weighted means, which take into account the correlation between our factors that results from having treatment groups with different sample sizes. A weighted mean is calculated by simply adding up all of the values and dividing by the total number of values. Consequently, we can easily derive the weighted means for each treatment group using our subset(data, condition) and mean(data) functions.
  1. > #use subset(data, condition) to create subsets for each treatment group
  2. > #offline subset
  3. > offlineData <- subset(dataTwoWayUnequalSample, dataTwoWayUnequalSample$environment == "offline")
  4. > #online subset
  5. > onlineData <- subset(dataTwoWayUnequalSample, dataTwoWayUnequalSample$environment == "online")
  6. > #classroom subset
  7. > classroomData <- subset(dataTwoWayUnequalSample, dataTwoWayUnequalSample$instruction == "classroom")
  8. > #tutor subset
  9. > tutorData <- subset(dataTwoWayUnequalSample, dataTwoWayUnequalSample$instruction == "tutor")
  10. > #use mean(data) to calculate the weighted means for each treatment group
  11. > #offline weighted mean
  12. > mean(offlineData$math)
  13. > #online weighted mean
  14. > mean(onlineData$math)
  15. > #classroom weighted mean
  16. > mean(classroomData$math)
  17. > #tutor weighted mean
  18. > mean(tutorData$math)

The weighted means for the environment and instruction conditions

ANOVA using Type I Sums of Squares

When applying weighted means, it is suggested that we use Type I sums of squares (SS) in our ANOVA. Type I happens to be the default SS used in our standard anova(object) function, which will be used to execute our analysis. Note that in the case of two-way ANOVA, the ordering of our independent variables matters when using weighted means. Therefore, we must run our ANOVA two times, once with each independent variable taking the lead. However, the interaction effect is not affected by the ordering of the independent variables.
  1. > #use anova(object) to execute the Type I SS ANOVAs
  2. > #environment ANOVA
  3. > anova(lm(math ~ environment * instruction, dataTwoWayUnequalSample))
  4. > #instruction ANOVA
  5. > anova(lm(math ~ instruction * environment, dataTwoWayUnequalSample))

The Type I SS ANOVA results. Note the differences in main effects based on the ordering of the independent variables.

These results indicate statistically insignificant main effects for both the environment and instruction variables, as well as the interaction between them.

Unweighted Means

Now let's turn to using unweighted means, which essentially ignore the correlation between the independent variables that arise from unequal sample sizes. An unweighted mean is calculated by taking the average of the individual group means. Thus, we can derive our unweighted means by summing the means of each level of our independent variables and dividing by the total number of levels. For instance, to find the unweighted mean for environment, we will add the means for our offline and online groups, then divide by two.
  1. > #use mean(data) and subset(data, condition) to calculate the unweighted means for each treatment group
  2. > #offline unweighted mean = (classroom offline mean + tutor offline mean) / 2
  3. (mean(subset(offlineData$math, offlineData$instruction == "classroom")) + mean(subset(offlineData$math, offlineData$instruction == "tutor"))) / 2
  4. > #online unweighted mean = (classroom online mean + tutor online mean) / 2
  5. > (mean(subset(onlineData$math, onlineData$instruction == "classroom")) + mean(subset(onlineData$math, onlineData$instruction == "tutor"))) / 2
  6. > #classroom unweighted mean = (offline classroom mean + online classroom mean) / 2
  7. > (mean(subset(classroomData$math, classroomData$environment == "offline")) + mean(subset(classroomData$math, classroomData$environment == "online"))) / 2
  8. > #tutor unweighted mean = (offline tutor mean + online tutor mean) / 2
  9. > (mean(subset(tutorData$math, tutorData$environment == "offline")) + mean(subset(tutorData$math, tutorData$environment == "online"))) / 2

The unweighted means for the environment and instruction conditions

ANOVA using Type III Sums of Squares

When applying unweighted means, it is suggested that we use Type III sums of squares (SS) in our ANOVA. Type III SS can be set using the type argument in the Anova(mod, type) function, which is a member of the car package.
  1. > #load the car package (install first, if necessary)
  2. > library(car)
  3. > #use the Anova(mod, type) function to conduct the Type III SS ANOVA
  4. > Anova(lm(math ~ environment * instruction, dataTwoWayUnequalSample), type = "3")

The Type III SS ANOVA results.

Once again, our ANOVA results indicate statistically insignificant main effects for both the environment and instruction variables, as well as the interaction between them. However, it is worth noting that both the means and p-values are different when using unweighted means and Type III SS compared to weighted means and Type I SS. In certain cases, this difference can be quite pronounced and lead to entirely different outcomes between the two methods. Hence, choosing the appropriate means and SS for a given analysis is a matter that should be approached with conscious consideration.

Pairwise Comparisons

Note that since our independent variables contain only two levels, there is no need to conduct follow-up comparisons. However, should you reach this point with a statistically significant independent variable of more than three levels, you could conduct pairwise comparisons in the same manner as demonstrated in the Two-Way ANOVA with Comparisons tutorial.

Complete Two-Way ANOVA with Unequal Sample Sizes Example

To see a complete example of how two-way ANOVA with unequal sample sizes can be conducted in R, please download the two-way ANOVA with unequal sample sizes example (.txt) file.

R Tutorial Series: Two-Way Repeated Measures ANOVA

Repeated measures data require a different analysis procedure than our typical two-way ANOVA and subsequently follow a different R process. This tutorial will demonstrate how to conduct two-way repeated measures ANOVA in R using the Anova() function from the car package.
Note that the two-way repeated measures ANOVA process can be very complex to organize and execute in R. Although it has been distilled into just a few small steps in this guide, it is recommended that you fully and precisely complete the example before experimenting with your own data. As you will see, organization of the raw data is critical to successfully conducting a two-way repeated measures ANOVA using the demonstrated technique.

Tutorial Files

Before we begin, you may want to download the sample data (.csv) and sample idata frame (.csv) used in this tutorial. Be sure to right-click and save the files to your R working directory. This dataset contains a hypothetical sample of 30 participants whose interest in school and interest in work was measured at three different ages (10, 15, and 20). The interest values are represented on a scale that ranges from 1 to 5 and indicate how interested each participant was in a given topic at each given age.

Data Setup

Notice that our data are arranged differently for a repeated measures ANOVA. In a typical two-way ANOVA, we would place all of the values of our independent variable in a single column and identify their respective levels with a second column, as demonstrated in this sample two-way dataset. In a two-way repeated measures ANOVA, we instead combine each independent variable with its time interval, thus yielding columns for each pairing. Hence, rather than having one vertical column for school interest and one for work interest, with a second column for age, we have six separate columns for interest, three for school interest and three for work interest at each age level. The following graphic is intended to help demonstrate this organization method.

Treat time as if it were an independent variable. Then combine each independent variable with each level of time and arrange the columns horizontally.

Beginning Steps

To begin, we need to read our dataset into R and store its contents in a variable.
  1. > #read the dataset into an R variable using the read.csv(file) function
  2. > dataTwoWayRepeatedMeasures <- read.csv("dataset_ANOVA_TwoWayRepeatedMeasures.csv")
  3. > #display the data
  4. > #notice the atypical column arrangement for repeated measures data
  5. > dataTwoWayRepeatedMeasures

The first ten rows of our dataset

idata Frame

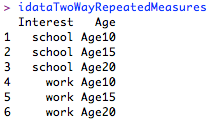
Another item that we need to import for this analysis is our idata frame. This object will be used in our Anova() function to define the structure of our analysis.
  1. > #read the idata frame into an R variable
  2. > idataTwoWayRepeatedMeasures <- read.csv("idata_ANOVA_TwoWayRepeatedMeasures.csv")
  3. > #display the idata frame
  4. > #notice the text values and correspondence between our idata rows and the columns in our dataset
  5. > idataTwoWayRepeatedMeasures

The idata frame

Note that it is critical that your idata frame take the demonstrated form for this technique to work. I experimented with several alternative, perhaps more intuitive, layouts without success. It is particularly important to notice that both columns of the idata frame contain text values (not numerical ones - hence the repeated prefixing of Age to the values in every row of the Age column). Additionally, if you read the rows of the idata frame horizontally, you will see that they correspond precisely to the columns of our dataset. The following graphic is intended to help demonstrate this organization method.


Use only text values in your idata frame. Ensure that the rows of your idata frame correspond to the columns in your dataset.

Linear Model

Prior to executing our analysis, we must follow two steps to formulate our linear model to be used in the Anova() function.

Step 1: Bind the Columns

  1. > #use cbind() to bind the columns of the original dataset
  2. > interestBind <- cbind(dataTwoWayRepeatedMeasures$schoolAge10, dataTwoWayRepeatedMeasures$schoolAge15, dataTwoWayRepeatedMeasures$schoolAge20, dataTwoWayRepeatedMeasures$workAge10, dataTwoWayRepeatedMeasures$workAge15, dataTwoWayRepeatedMeasures$workAge20)

Step 2: Define the Model

  1. > #use lm() to generate a linear model using the bound columns from step 1
  2. > interestModel <- lm(interestBind ~ 1)

Anova(mod, idata, idesign) Function

Typically, researchers will choose one of several techniques for analyzing repeated measures data, such as an epsilon-correction method, like Huynh-Feldt or Greenhouse-Geisser, or a multivariate method, like Wilks' Lambda or Hotelling's Trace. Conveniently, having already prepared our data, we can employ a single Anova(mod, idata, idesign) function from the car package to yield all of the relevant repeated measures results. This allows us simplicity in that only a single function is required, regardless of the technique that we wish to employ. Thus, witnessing our outcomes becomes as simple as locating the desired method in the cleanly printed results.
Our Anova(mod, idata, idesign) function will be composed of three arguments. First, mod will contain our linear model. Second, idata will contain our data frame. Third, idesign will contain a multiplication of the row headings from our idata frame (in other words, our independent variables), preceded by a tilde (~). Thus, our final function takes on the following form.
  1. > #load the car package (install first, if necessary)
  2. library(car)
  3. > #compose the Anova(mod, idata, idesign) function
  4. > analysis <- Anova(interestModel, idata = idataTwoWayRepeatedMeasures, idesign = ~Interest * Age)

Results Summary

Finally, we can use the summary(object) function to visualize the results of our repeated measures ANOVA.
  1. > #use summary(object) to visualize the results of the repeated measures ANOVA
  2. > summary(analysis)

Relevant segment of repeated measures ANOVA results

Supposing that we are interested in the Wilks' Lambda method, we can see that there is a statistically significant interaction effect between interest in school and interest in work across the age groups (p < .001). This suggests that we should further examine our data at the level of simple main effects. For more information investigating on simple main effects, see the Two-Way ANOVA with Interactions and Simple Main Effects tutorial. Of course, in this case of repeated measures ANOVA, another way to break the data down would be to run two one-way repeated measures ANOVAs, one for each of the independent variables. In either instance, pairwise comparisons can be conducted to determine the significance of the differences between the levels of any significant effects.

Complete Two-Way Repeated Measures ANOVA Example

To see a complete example of how two-way repeated measures ANOVA can be conducted in R, please download the two-way repeated measures ANOVA example (.txt) file.

References

Moore, Colleen. (n.d.). 610 R9 -- Two-way Repeated-measures Anova. Retrieved January 21, 2011 from http://psych.wisc.edu/moore/Rpdf/610-R9_Within2way.pdf

R Tutorial Series: Two-Way ANOVA with Interactions and Simple Main Effects

When an interaction is present in a two-way ANOVA, we typically choose to ignore the main effects and elect to investigate the simple main effects when making pairwise comparisons. This tutorial will demonstrate how to conduct pairwise comparisons when an interaction is present in a two-way ANOVA.

Tutorial Files

Before we begin, you may want to download the sample data (.csv) used in this tutorial. Be sure to right-click and save the file to your R working directory. This dataset contains a hypothetical sample of 60 participants who are divided into three stress reduction treatment groups (mental, physical, and medical) and two gender groups (male and female). The stress reduction values are represented on a scale that ranges from 1 to 5. This dataset can be conceptualized as a comparison between three stress treatment programs, one using mental methods, one using physical training, and one using medication across genders. The values represent how effective the treatment programs were at reducing participant's stress levels, with higher numbers indicating higher effectiveness.

Beginning Steps

To begin, we need to read our dataset into R and store its contents in a variable.
  1. > #read the dataset into an R variable using the read.csv(file) function
  2. > dataTwoWayInteraction <- read.csv("dataset_ANOVA_TwoWayInteraction.csv")
  3. > #display the data
  4. > dataTwoWayInteraction

The first ten rows of our dataset.

Omnibus Test

Let's run a general omnibus test to assess the main effects and interactions present in the dataset.
  1. > #use anova(object) to test the omnibus hypothesis
  2. > #Are main effects or interaction effects present in the independent variables?
  3. > anova(lm(StressReduction ~ Treatment * Gender, dataTwoWayInteraction))

The omnibus ANOVA test

Divide the Data

The significant omnibus interaction suggests that we should ignore the main effects and instead investigate the simple main effects for our independent variables. To do so, we need to divide our dataset along each level of our treatment variable. We can create subsets of our dataset using the subset(data, condition) function, where data is the original dataset and condition contains the parameters defining the subset.
  1. > #use subset(data, condition) to divide the original dataset
  2. > #medical subset
  3. > dataMedical <- subset(dataTwoWayInteraction, Treatment == "medical")
  4. > #mental subset
  5. > dataMental <- subset(dataTwoWayInteraction, Treatment == "mental")
  6. > #physical subset
  7. > dataPhysical <- subset(dataTwoWayInteraction, Treatment == "physical")

Group ANOVAs

With datasets representing each of our treatment groups, we can now run an ANOVA for each that investigates the impact of gender. You may notice that this is effectively running three one-way ANOVAs with gender being the independent variable. Therefore, we should control for Type I error by dividing our typical .05 alpha level by three (.017).
  1. > #run ANOVA on the treatment subsets to investigate the impacts of gender within each
  2. > #medical
  3. > anova(lm(StressReduction ~ Gender, dataMedical))
  4. > #mental
  5. > anova(lm(StressReduction ~ Gender, dataMental))
  6. > #physical
  7. > anova(lm(StressReduction ~ Gender, dataPhysical))

The gender within treatment group ANOVA tests

At an alpha level of .017, the gender effect within the mental (p = .014) and physical (p < .001) groups was statistically significant. In the mental condition, the means are 3 for males and 4 for females. In the physical condition, the means are 4 for males and 2 for females. These results suggest that the mental treatment is more effective in reducing stress for females than males, while the physical treatment is more effective for males than females. Further, there is insufficient statistical support for a gender difference in the medical treatment.

Pairwise Comparisons

Note that since our gender variable contains only two levels, there is no need to conduct follow-up comparisons. However, should you reach this point with an independent variable of more than three levels, you could conduct pairwise comparisons in the same manner as demonstrated in the Two-Way ANOVA with Comparisons tutorial. In this case, remember to carry through your reduced Type I error rate from the preceding ANOVA tests.

Complete Two-Way ANOVA with Interactions Example

To see a complete example of how two-way ANOVA simple main effects can be explored in R, please download the two-way ANOVA interaction example (.txt) file.

R Tutorial Series: Two-Way ANOVA with Pairwise Comparisons

By extending our one-way ANOVA procedure, we can test the pairwise comparisons between the levels of several independent variables. This tutorial will demonstrate how to conduct pairwise comparisons in a two-way ANOVA.

Tutorial Files

Before we begin, you may want to download the sample data (.csv) used in this tutorial. Be sure to right-click and save the file to your R working directory. This dataset contains a hypothetical sample of 27 participants who are divided into three stress reduction treatment groups (mental, physical, and medical) and three age groups (young, mid, and old). The stress reduction values are represented on a scale that ranges from 0 to 10. This dataset can be conceptualized as a comparison between three stress treatment programs, one using mental methods, one using physical training, and one using medication, across three age groups. The stress reduction values represent how effective the treatment programs were at reducing participant's stress levels, with higher numbers indicating higher effectiveness. Note that the numbers in this dataset are not very realistic and are simply used to make this example possible.

Beginning Steps

To begin, we need to read our dataset into R and store its contents in a variable.
  1. > #read the dataset into an R variable using the read.csv(file) function
  2. > dataTwoWayComparisons <- read.csv("dataset_ANOVA_TwoWayComparisons.csv")
  3. > #display the data
  4. > dataTwoWayComparisons

The first ten rows of our dataset.

Omnibus Test

Let's run a general omnibus test to assess the main effects and interactions present in the dataset.
  1. > #use anova(object) to test the omnibus hypothesis
  2. > #Are main effects or interaction effects present in the independent variables?
  3. > anova(lm(StressReduction ~ Treatment * Age, dataTwoWayComparisons))

The omnibus ANOVA test

Pairwise Comparisons

Since the omnibus test was significant for both variables and no interaction effect was present, we can proceed to testing the main effect pairwise comparisons. To accomplish this, we will apply our pairwise.t.test() function to each of our independent variables. For more details on the pairwise.t.test() function, see the One-Way ANOVA with Pairwise Comparisons tutorial.
  1. > #use pairwise.t.test(x, g, p.adj) to test the pairwise comparisons between the treatment group means
  2. > #What significant differences are present amongst the treatment means?
  3. > pairwise.t.test(dataTwoWayComparisons$StressReduction, dataTwoWayComparisons$Treatment, p.adj = "none")
  4. > #use pairwise.t.test(x, g, p.adj) to test the pairwise comparisons between the age group means
  5. > #What significant differences are present amongst the age group means?
  6. > pairwise.t.test(dataTwoWayComparisons$StressReduction, dataTwoWayComparisons$Age, p.adj = "none")

Pairwise comparisons of treatment group means


Pairwise comparisons of age group means

Note that the desired p-adjustment method will vary by researcher, study, etc. Here, we will assume an alpha level of .05 for all tests, effectively making no adjustment for the family-wise Type I error rate.
These results indicate that there are are no statistically significant pairwise differences between the treatment groups and that all of the comparisons between age groups are statistically significant. The age group means are 8 for young, 5 for mid, and 2 for old. Consequently, we are inclined to conclude that, regardless of treatment, young patients are going to be most responsive, followed by middle aged patients, followed by older ones. However, there is insufficient support to differentiate between the effectiveness of the treatment methods themselves.

Complete Two-Way ANOVA with Pairwise Comparisons Example

To see a complete example of how two-way ANOVA pairwise comparisons can be conducted in R, please download the two-way ANOVA comparisons example (.txt) file.

R Tutorial Series: Two-Way Omnibus ANOVA

As with the one-way case, testing the omnibus hypothesis via two-way ANOVA is simple process in R. This tutorial will explore how R can be used to perform a two-way ANOVA to test the difference between two (or more) group means.

Tutorial Files

Before we begin, you may want to download the sample data (.csv) used in this tutorial. Be sure to right-click and save the file to your R working directory. This dataset contains a hypothetical sample of 60 participants who are divided by gender (male and female) and treatment group (control and treatment). The values represent a scale that ranges from 1 to 5. For instance, this dataset could be conceptualized as a comparison between two professional training programs, where the control group participated the company's longstanding program and the treatment group participated in an experimental program. The values could represent the attitudes of employees towards the training programs on a scale from 1 (poor) to 5 (excellent).

Beginning Steps

To begin, we need to read our dataset into R and store its contents in a variable.
  1. > #read the two-way ANOVA dataset into an R variable using the read.csv(file) function
  2. > dataTwoWay <- read.csv("dataset_ANOVA_TwoWay.csv")
  3. > #display the data
  4. > dataTwoWay

The first ten rows of our two-way ANOVA dataset.

Two-Way ANOVA

Now that our data are ready, we can conduct a two-way omnibus ANOVA test using the anova(object) function. Note that the only step necessary to add a second independent variable into our ANOVA model is to incorporate it into our lm(model, dataset) function using the * operator. Whereas our one-way model was lm(Values ~ Group), our two-way model becomes lm(Values ~ Group * Gender). As you can see from the results below, adding a second independent variable in this manner also gives us information about the interaction between our variables.
  1. > #use anova(object) to test the omnibus hypothesis in two-way ANOVA
  2. > #Are the differences between the group means for treatment and gender statistically significant?
  3. > #Is there a statistically significant interaction between treatment and gender?
  4. > anova(lm(Values ~ Group * Gender, dataTwoWay))

Our two-way ANOVA table.

The output of our ANOVA test indicates that the difference between our treatment group means is statistically significant (p < .001) and that the difference between genders is not (p = .585). However, in light of the statistically significant interaction between treatment group and gender (p = .032), we would generally elect to forgo these main effects. Subsequently, a series of follow-up procedures could be carried out to examine the simple main effects for treatment group and gender.

Two-Way Multiple Group ANOVA

Conducting a two-way omnibus ANOVA with multiple groups is identical to the demonstrated two-group test. The only difference is that the values in your dataset would be associated with more than two groups. Subsequently, the omnibus hypothesis would test for mean differences across all of the groups. The anova(object) function and its contained lm(formula, data) function would remain the same.

Complete Two-Way Omnibus ANOVA Example

To see a complete example of how a two-way omnibus ANOVA can be conducted in R, please download the two-way ANOVA example (.txt) file.