Tutorial Files
Before we begin, you may want to download the sample data (.csv) used in this tutorial. Be sure to right-click and save the file to your R working directory. This dataset contains a hypothetical sample of 30 students who were exposed to one of two learning environments (offline or online) and one of two methods of instruction (classroom or tutor), then tested on a math assessment. Possible math scores range from 0 to 100 and indicate how well each student performed on the math assessment. Each student participated in either an offline or online learning environment and received either classroom instruction (i.e. one to many) or instruction from a personal tutor (i.e. one to one).Beginning Steps
To begin, we need to read our dataset into R and store its contents in a variable.
- > #read the dataset into an R variable using the read.csv(file) function
- > dataTwoWayUnequalSample <- read.csv("dataset_ANOVA_TwoWayUnequalSample.csv")
- > #display the data
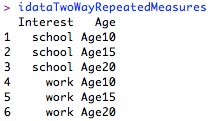
- > dataTwoWayUnequalSample

The first ten rows of our dataset
Unequal Sample Sizes
In our study, 16 students participated in the online environment, whereas only 14 participated in the offline environment. Further, 20 students received classroom instruction, whereas only 10 received personal tutor instruction. As such, we should take action to compensate for the unequal sample sizes in order to retain the validity of our analysis. Generally, this comes down to examining the correlation between the factors and the causes of the unequal sample sizes en route to choosing whether to use weighted or unweighted means - a decision which can drastically impact the results of an ANOVA. This tutorial will demonstrate how to conduct ANOVA using both weighted and unweighted means. Thus, the ultimate decision as to the use of weighted or unweighted means is left up to each individual and his or her specific circumstances.Weighted Means
First, let's suppose that we decided to go with weighted means, which take into account the correlation between our factors that results from having treatment groups with different sample sizes. A weighted mean is calculated by simply adding up all of the values and dividing by the total number of values. Consequently, we can easily derive the weighted means for each treatment group using our subset(data, condition) and mean(data) functions.
- > #use subset(data, condition) to create subsets for each treatment group
- > #offline subset
- > offlineData <- subset(dataTwoWayUnequalSample, dataTwoWayUnequalSample$environment == "offline")
- > #online subset
- > onlineData <- subset(dataTwoWayUnequalSample, dataTwoWayUnequalSample$environment == "online")
- > #classroom subset
- > classroomData <- subset(dataTwoWayUnequalSample, dataTwoWayUnequalSample$instruction == "classroom")
- > #tutor subset
- > tutorData <- subset(dataTwoWayUnequalSample, dataTwoWayUnequalSample$instruction == "tutor")
- > #use mean(data) to calculate the weighted means for each treatment group
- > #offline weighted mean
- > mean(offlineData$math)
- > #online weighted mean
- > mean(onlineData$math)
- > #classroom weighted mean
- > mean(classroomData$math)
- > #tutor weighted mean
- > mean(tutorData$math)

The weighted means for the environment and instruction conditions
ANOVA using Type I Sums of Squares
When applying weighted means, it is suggested that we use Type I sums of squares (SS) in our ANOVA. Type I happens to be the default SS used in our standard anova(object) function, which will be used to execute our analysis. Note that in the case of two-way ANOVA, the ordering of our independent variables matters when using weighted means. Therefore, we must run our ANOVA two times, once with each independent variable taking the lead. However, the interaction effect is not affected by the ordering of the independent variables.
- > #use anova(object) to execute the Type I SS ANOVAs
- > #environment ANOVA
- > anova(lm(math ~ environment * instruction, dataTwoWayUnequalSample))
- > #instruction ANOVA
- > anova(lm(math ~ instruction * environment, dataTwoWayUnequalSample))

The Type I SS ANOVA results. Note the differences in main effects based on the ordering of the independent variables.
These results indicate statistically insignificant main effects for both the environment and instruction variables, as well as the interaction between them.
Unweighted Means
Now let's turn to using unweighted means, which essentially ignore the correlation between the independent variables that arise from unequal sample sizes. An unweighted mean is calculated by taking the average of the individual group means. Thus, we can derive our unweighted means by summing the means of each level of our independent variables and dividing by the total number of levels. For instance, to find the unweighted mean for environment, we will add the means for our offline and online groups, then divide by two.
- > #use mean(data) and subset(data, condition) to calculate the unweighted means for each treatment group
- > #offline unweighted mean = (classroom offline mean + tutor offline mean) / 2
- (mean(subset(offlineData$math, offlineData$instruction == "classroom")) + mean(subset(offlineData$math, offlineData$instruction == "tutor"))) / 2
- > #online unweighted mean = (classroom online mean + tutor online mean) / 2
- > (mean(subset(onlineData$math, onlineData$instruction == "classroom")) + mean(subset(onlineData$math, onlineData$instruction == "tutor"))) / 2
- > #classroom unweighted mean = (offline classroom mean + online classroom mean) / 2
- > (mean(subset(classroomData$math, classroomData$environment == "offline")) + mean(subset(classroomData$math, classroomData$environment == "online"))) / 2
- > #tutor unweighted mean = (offline tutor mean + online tutor mean) / 2
- > (mean(subset(tutorData$math, tutorData$environment == "offline")) + mean(subset(tutorData$math, tutorData$environment == "online"))) / 2

The unweighted means for the environment and instruction conditions
ANOVA using Type III Sums of Squares
When applying unweighted means, it is suggested that we use Type III sums of squares (SS) in our ANOVA. Type III SS can be set using the type argument in the Anova(mod, type) function, which is a member of the car package.
- > #load the car package (install first, if necessary)
- > library(car)
- > #use the Anova(mod, type) function to conduct the Type III SS ANOVA
- > Anova(lm(math ~ environment * instruction, dataTwoWayUnequalSample), type = "3")

The Type III SS ANOVA results.
Once again, our ANOVA results indicate statistically insignificant main effects for both the environment and instruction variables, as well as the interaction between them. However, it is worth noting that both the means and p-values are different when using unweighted means and Type III SS compared to weighted means and Type I SS. In certain cases, this difference can be quite pronounced and lead to entirely different outcomes between the two methods. Hence, choosing the appropriate means and SS for a given analysis is a matter that should be approached with conscious consideration.