Note that the two-way repeated measures ANOVA process can be very complex to organize and execute in R. Although it has been distilled into just a few small steps in this guide, it is recommended that you fully and precisely complete the example before experimenting with your own data. As you will see, organization of the raw data is critical to successfully conducting a two-way repeated measures ANOVA using the demonstrated technique.
Tutorial Files
Before we begin, you may want to download the sample data (.csv) and sample idata frame (.csv) used in this tutorial. Be sure to right-click and save the files to your R working directory. This dataset contains a hypothetical sample of 30 participants whose interest in school and interest in work was measured at three different ages (10, 15, and 20). The interest values are represented on a scale that ranges from 1 to 5 and indicate how interested each participant was in a given topic at each given age.Data Setup
Notice that our data are arranged differently for a repeated measures ANOVA. In a typical two-way ANOVA, we would place all of the values of our independent variable in a single column and identify their respective levels with a second column, as demonstrated in this sample two-way dataset. In a two-way repeated measures ANOVA, we instead combine each independent variable with its time interval, thus yielding columns for each pairing. Hence, rather than having one vertical column for school interest and one for work interest, with a second column for age, we have six separate columns for interest, three for school interest and three for work interest at each age level. The following graphic is intended to help demonstrate this organization method.
Treat time as if it were an independent variable. Then combine each independent variable with each level of time and arrange the columns horizontally.
Beginning Steps
To begin, we need to read our dataset into R and store its contents in a variable.
- > #read the dataset into an R variable using the read.csv(file) function
- > dataTwoWayRepeatedMeasures <- read.csv("dataset_ANOVA_TwoWayRepeatedMeasures.csv")
- > #display the data
- > #notice the atypical column arrangement for repeated measures data
- > dataTwoWayRepeatedMeasures

The first ten rows of our dataset
idata Frame
Another item that we need to import for this analysis is our idata frame. This object will be used in our Anova() function to define the structure of our analysis.
- > #read the idata frame into an R variable
- > idataTwoWayRepeatedMeasures <- read.csv("idata_ANOVA_TwoWayRepeatedMeasures.csv")
- > #display the idata frame
- > #notice the text values and correspondence between our idata rows and the columns in our dataset
- > idataTwoWayRepeatedMeasures
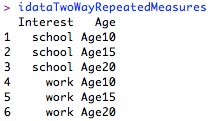
The idata frame
Note that it is critical that your idata frame take the demonstrated form for this technique to work. I experimented with several alternative, perhaps more intuitive, layouts without success. It is particularly important to notice that both columns of the idata frame contain text values (not numerical ones - hence the repeated prefixing of Age to the values in every row of the Age column). Additionally, if you read the rows of the idata frame horizontally, you will see that they correspond precisely to the columns of our dataset. The following graphic is intended to help demonstrate this organization method.

Use only text values in your idata frame. Ensure that the rows of your idata frame correspond to the columns in your dataset.
Linear Model
Prior to executing our analysis, we must follow two steps to formulate our linear model to be used in the Anova() function.Step 1: Bind the Columns
- > #use cbind() to bind the columns of the original dataset
- > interestBind <- cbind(dataTwoWayRepeatedMeasures$schoolAge10, dataTwoWayRepeatedMeasures$schoolAge15, dataTwoWayRepeatedMeasures$schoolAge20, dataTwoWayRepeatedMeasures$workAge10, dataTwoWayRepeatedMeasures$workAge15, dataTwoWayRepeatedMeasures$workAge20)
Step 2: Define the Model
- > #use lm() to generate a linear model using the bound columns from step 1
- > interestModel <- lm(interestBind ~ 1)
Anova(mod, idata, idesign) Function
Typically, researchers will choose one of several techniques for analyzing repeated measures data, such as an epsilon-correction method, like Huynh-Feldt or Greenhouse-Geisser, or a multivariate method, like Wilks' Lambda or Hotelling's Trace. Conveniently, having already prepared our data, we can employ a single Anova(mod, idata, idesign) function from the car package to yield all of the relevant repeated measures results. This allows us simplicity in that only a single function is required, regardless of the technique that we wish to employ. Thus, witnessing our outcomes becomes as simple as locating the desired method in the cleanly printed results.Our Anova(mod, idata, idesign) function will be composed of three arguments. First, mod will contain our linear model. Second, idata will contain our data frame. Third, idesign will contain a multiplication of the row headings from our idata frame (in other words, our independent variables), preceded by a tilde (~). Thus, our final function takes on the following form.
- > #load the car package (install first, if necessary)
- library(car)
- > #compose the Anova(mod, idata, idesign) function
- > analysis <- Anova(interestModel, idata = idataTwoWayRepeatedMeasures, idesign = ~Interest * Age)
Results Summary
Finally, we can use the summary(object) function to visualize the results of our repeated measures ANOVA.
- > #use summary(object) to visualize the results of the repeated measures ANOVA
- > summary(analysis)

Relevant segment of repeated measures ANOVA results
Supposing that we are interested in the Wilks' Lambda method, we can see that there is a statistically significant interaction effect between interest in school and interest in work across the age groups (p < .001). This suggests that we should further examine our data at the level of simple main effects. For more information investigating on simple main effects, see the Two-Way ANOVA with Interactions and Simple Main Effects tutorial. Of course, in this case of repeated measures ANOVA, another way to break the data down would be to run two one-way repeated measures ANOVAs, one for each of the independent variables. In either instance, pairwise comparisons can be conducted to determine the significance of the differences between the levels of any significant effects.
Two things... didn't work... I got
ReplyDelete"Note: model has only an intercept; equivalent type-III tests substituted."
when generating the Anova.
Also, the cbind command is just really a very verbose way of saying you want to make a matrix out of all of the dependent variable colunns of the data. ... as.matrix(data[,2:7])
(note... that's not why I got the error because I actually did it the way things are described... both ways came out the same)
Thanks for the comments. The error is common, but does not appear to affect the results in any of the instances that I have used this method.
ReplyDeleteThat's a MANOVA, not an ANOVA. To see the ANOVA you would need to enter summary(analysis, multivariate=FALSE)
ReplyDeleteUsing multivariate = FALSE removes the multivariate tests from the output (e.g. Pillai, Wilks, etc.). From every indication that I have seen, it is acceptable practice to use multivariate techniques to execute repeated measures ANOVA, thus evading the sphericity/compound symmetry assumptions.
ReplyDeleteUsing multivariate techniques is certainly appropriate. I'm not disagreeing with that at all. What I'm saying is that then it's not an ANOVA, it's a MANOVA. The univariate test doesn't just remove the multivariate results but it also provides different results.
ReplyDeleteAs an aside, MANOVA is not the panacea it was first believed to be with respect to circumventing the problems with repeated measures designs.
At least this comment might be able to have this come up in people's searches.
Dear, do you have some script for unbalanced design for two-way ANOVA with repeated measurements?
ReplyDeleteHi. I do not have a specific example for this scenario. However, I do have tutorials for two-way repeated measures and two-way ANOVA with unequal sample sizes. You may be able to adapt the methods from both tutorials to your situation. I also recommend validating your methodology with a statistician.
ReplyDeleteHi what I want to ask is that you suggest braking down 2 way repeated measures anova to one way repeated measures anova for further analysis is that un-parsimonious??
ReplyDeleteHi. In the case of an interaction, you need to examine your data further, which requires separating the dataset along one of the interacting variables. In this case, if Age and Interest are interacting, the dataset must be divided along one of them. This can be accomplished by looking at Interest within all three levels of Age (10, 15, 20) or by looking at Age within both levels of Interest (school, work). Since multiple tests are required, you control for the Type I error rate by reducing it. See the Two-Way ANOVA with Interactions and Simple Main Effects tutorial for details on this process.
ReplyDeleteHello
ReplyDeletecould this set up be used to test two within-subject factors like behaviour (chase or dive-bomb)and intruder (female or male) instead of a time series?
I am trying to replicate this study:
"Contingency analyses were not appropriate because
multiple behaviors were recorded for each resident. To determine whether resident birds treated male and female intruders differently,we performed repeated-measures ANOVA.
The two within-subject fixed factors were Behavior
(chase, dive) and Intruder Sex (male, female).
Each subject was regarded as a unit of observation
and provided the random variate for analysis.
We examined the number of times a subject performed
each behavior in the presence of male and female
intruders."
Please help.
Yes, this can be done with things other than time. The important thing is identifying something that has been repeated in the study. From the description, it sounds like they measured the same birds' behaviors multiple times. For example, Bird A dove when confronted with a male intruder, Bird A chased when confronted with a female intruder, and so on. Each confrontation situation presented should be a repeated measures column. For example, BehaviorMale1, BehaviorFemale1, etc. to represent each behavior measured in each confrontation situation.
DeleteHi John,
ReplyDeleteThanks for the great tutorial, it explained a lot. I have a query about the organisation of the data. I want to compare differences in fish growth between 4 sites, I have 4 repeated measurements of fish size for 14 fish per site. If I organise my data like your example R only thinks I have 14 fish in total and the df in the MANOVA test are wrong. Could you please explain how I should organise my data and idata??
Any help would be much appreciated. Cheers, Jen
Hi Jen. Look at the first image in this tutorial. Instead of subject, you would have a column called fish, which would have fish1, fish2, ... fish56. Your repeated measures variable is growth, which is taken at four time points. Therefore, you will need columns for each possible combination: sizeTime1, sizeTime2, sizeTime3, sizeTime4. Site is not a repeated measures variable, so that is just one more column in your dataset that associates each fish with its location.
DeleteJohn, thank you for this tutorials!
DeleteSorry if this is an idiotic question, but if Jen creates another column for the site location, then how would she distinguish between the fish at different sites within the statistics?
I have a similar study in which I have two treatment groups measured by a pretest, posttest, and delayed posttest. I can make the subject ID as column 1, and each of the scores for pretest, posttest, and delayed posttest as columns, as well as a column for treatment type.
But (very much a beginner to R) how do I get it to statistically compare the two treatment groups over time (i.e. treatment, time, treatment*time)?
Thank you,
John
The example (two-way repeated measures ANOVA example (.txt) ) is great and I could apply it very easily to my analysis, thanks! I am desperate to know how to look at the residuals and check distribution, outliers, etc. from there. Any hint would be very helpful. Thanks, Solene.
ReplyDeleteThanks for the tutorial. Unfortunately, I get this error message when using my own data:
ReplyDeleteError in `contrasts<-`(`*tmp*`, value = if (is.ordered(idata[, i])) icontrasts[2] else icontrasts[1]) :
contrasts apply only to factors
Any idea what I'm doing wrong?
You need to convert the equivalent variable to Age in this case to a factor.
ReplyDeleteHello, I get as well an error message after my analysis. I am farily new to R, so any suggestions what went wrong here would be very much appreciated. Many thanks, Wiebke
ReplyDeleteError in eigen(qr.coef(SSPE.qr, x$SSPH), symmetric = FALSE) :
infinite or missing values in 'x'
In addition: Warning message:
In summary.Anova.mlm(analysis) : Singular error SSP matrix:
non-sphericity test and corrections not available
I also get these errors, no matter how careful I write the code according the the instructions above:
ReplyDelete"Note: model has only an intercept; equivalent type-III tests substituted.
Warning message:
In summary.Anova.mlm(analysisABC): Singular error SSP matrix:
non-sphericity test and corrections not available"
How do I run a three way repeated measures anova?
ReplyDeletehow to run post hoc after two way repeated measures ANOVA?
ReplyDelete